Getting Started
This getting started guide will walk you through the basics of Connect I/O. You will learn about the graphical user interface, available nodes and how to create a simple diagram.
User Interface
If you are new to Connect I/O, it will be useful to get an introduction to a few basic concepts regarding the user interface.
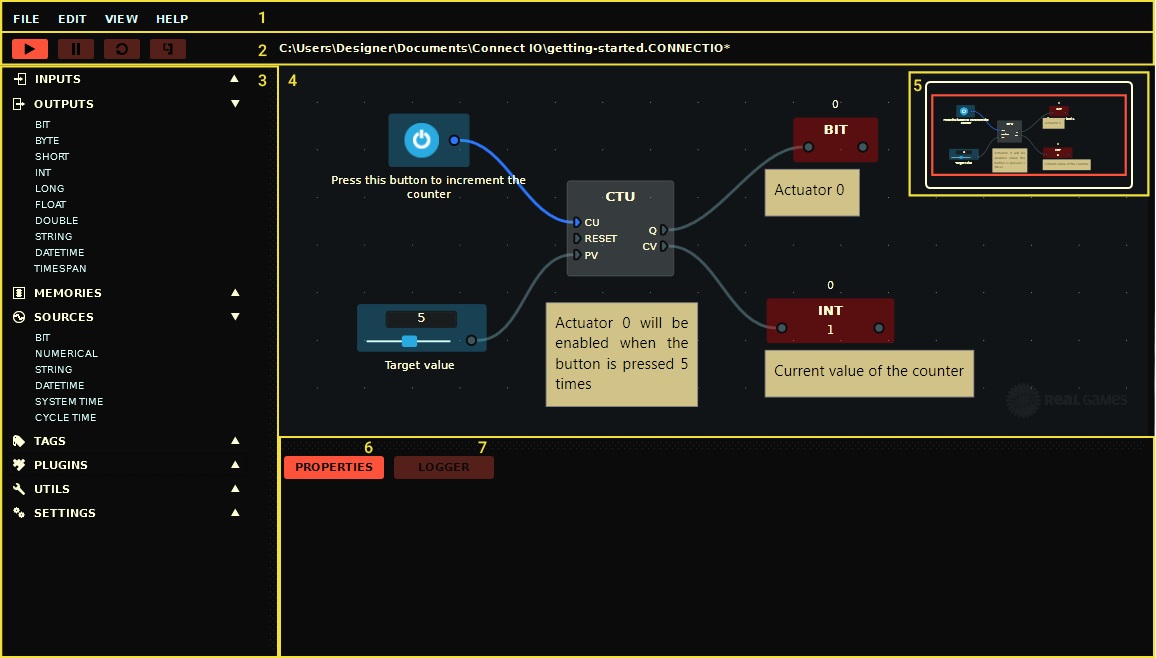
| 1. Menu | Gives access to general commands. |
| 2. Toolbar | Controls the diagram execution. Use it to start, pause, reset or perform a single diagram update cycle. |
| 3. Nodes Palette | Hierarchical list of all nodes grouped by node type. |
| 4. Canvas | Where you draw the diagram. |
| 5. Canvas Overview | Gives a visual representation of the entire diagram. |
| 6. Properties | Displays the editable properties and documentation of the selected node. |
| 7. Logger | Displays useful information. |
Nodes
All nodes are made of sockets which are used to link nodes together. Output sockets can only be linked to input sockets, you cannot create loops by linking output sockets to input sockets directly. In order to create loops in your diagrams, you will have to use memories, more on this later.
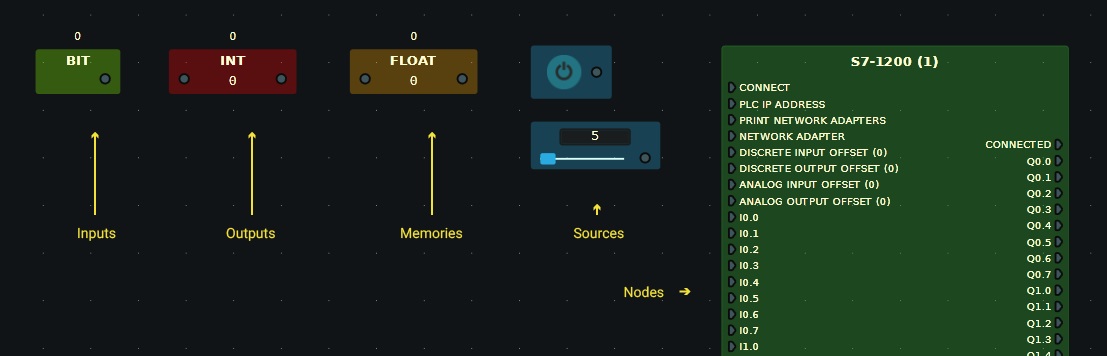
There are five types of nodes:
- Inputs: used to read sensors values (e.g. a switch state).
- Outputs: used to write actuators values (e.g. turn a light on/off).
- Memories: used to store values during the execution of the diagram or, in some special cases, to read or write values from/to the simulations.
- Sources: used as source of values, you will find a different node for each data type supported.
- Nodes: nodes that provide some kind of functionality (e.g. connection with a Siemens PLC through Ethernet or simply a node that multiplies two numbers).
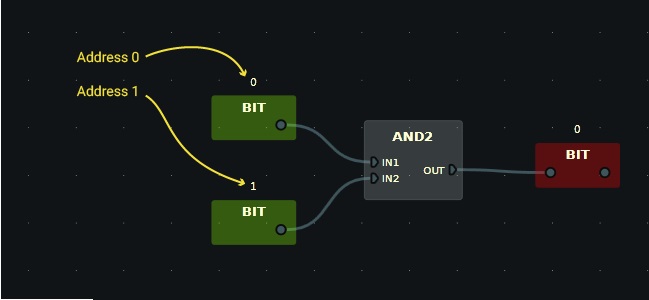
Each different data type of Inputs, Outputs and Memories (i.e. Bit, Byte, Short, Int, Long, etc.) has a memory address. For instance, to use different Bit inputs you have to set one to address 0 and the other to address 1.
Creating a Diagram
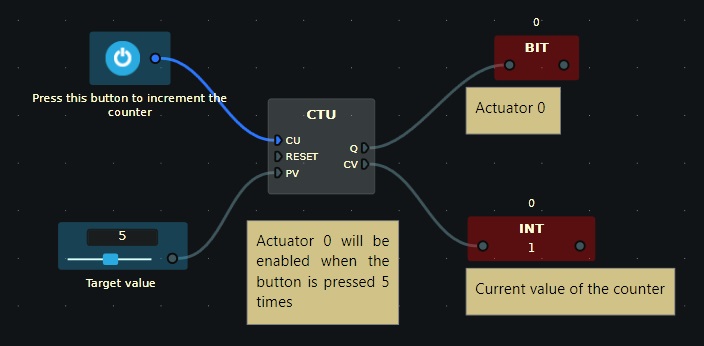
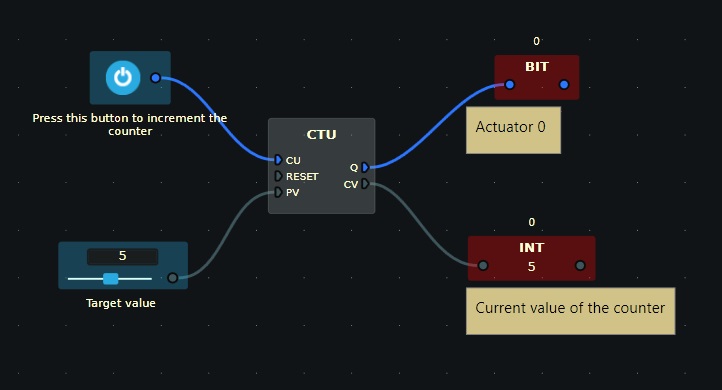
To understand the basic operation of Connect I/O we are going to create the diagram presented in the image displayed at the top of this page. This diagram has a simple purpose: set an output to true when a counter reaches the target value of 5.
-
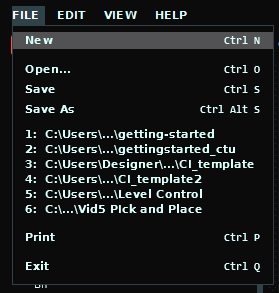
To create a new diagram, choose New from the File Menu (Ctrl + N).
-
Start by placing a CTU (up counter) node by expanding the Plugins > Function Blocks > Counters categories on the Nodes Palette and dragging the CTU node into the canvas.
-
Left-click on the previously created node to show the node's documentation on the Properties Panel.
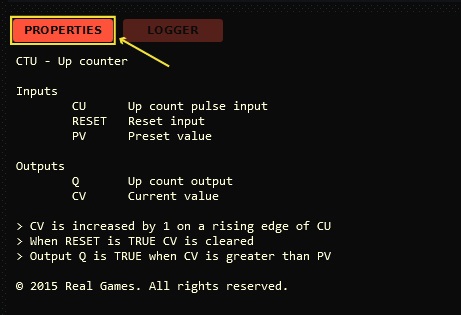
From the documentation, you can see that we will need to drive two of the counter's input sockets to achieve our goal: a Bit source to drive the CU (up count pulse input), and a Numerical source to set the PV (preset value). You will also need the output, a Bit output node, which has to be connected to the Q output socket of the counter.
-
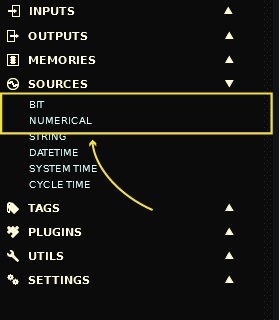
Let's start by adding the Bit and Numerical sources. These can be found in the Sources category of the palette.
-
Since we want the counter to turn on upon reaching 5 (setting PV to 5), we must set the Numerical source value to 5. Before setting this value, it's important to set first the minimum and maximum values allowed by this node. Left-click on the Numerical node to select it, next Left-click on the Properties Panel and insert 10 as the MAX limit. Now, when dragging the Numerical slider, values will change between MIN (0) and MAX (10) values. Alternatively, you may set the value directly by left clicking on the node's input field and typing it.
-
To make our diagram easier to understand at a latter time, it's a good practice to add names to source nodes. Select the Numerical node by left-clicking on it and on the Properties Panel insert the name in the Name field.
Attention
Do NOT use the Name field for inputs, outputs or memory nodes since these will be used by HOME I/O. Use the Note node instead (UTILS > NOTE).
-
Link the correct sockets, as shown in the image below. You create links by Left-clicking and holding from an output socket into an input socket.
-
Now its time to place the Bit output node. Expand the Outputs category and drag a Bit and an Int into the canvas. The Int output node will be used to display the current value of the counter. Connect the nodes as shown in the image below and the diagram is now complete.
-
At this point, you should save your work by selecting Save from the File Menu.
Testing
Now that the diagram is done Left-click on the Bit input (button) to increment the counter. When it reaches 5 (the preset value), it will set the output Bit to true.
You can reset the diagram to its initial state by pressing the Restart button on the toolbar. Please note that Inputs, Outputs, Memories and Sources will retain their value.
Some important remarks:
- Sockets and links between sockets that transmit true/false values (Boolean values) become blue colored when the value is true and gray colored when the value is false.
- By default, a diagram is always running even when editing it. The diagram execution can be paused by pressing the Pause button on the Toolbar.